Beijing Smart City Big Data Screen
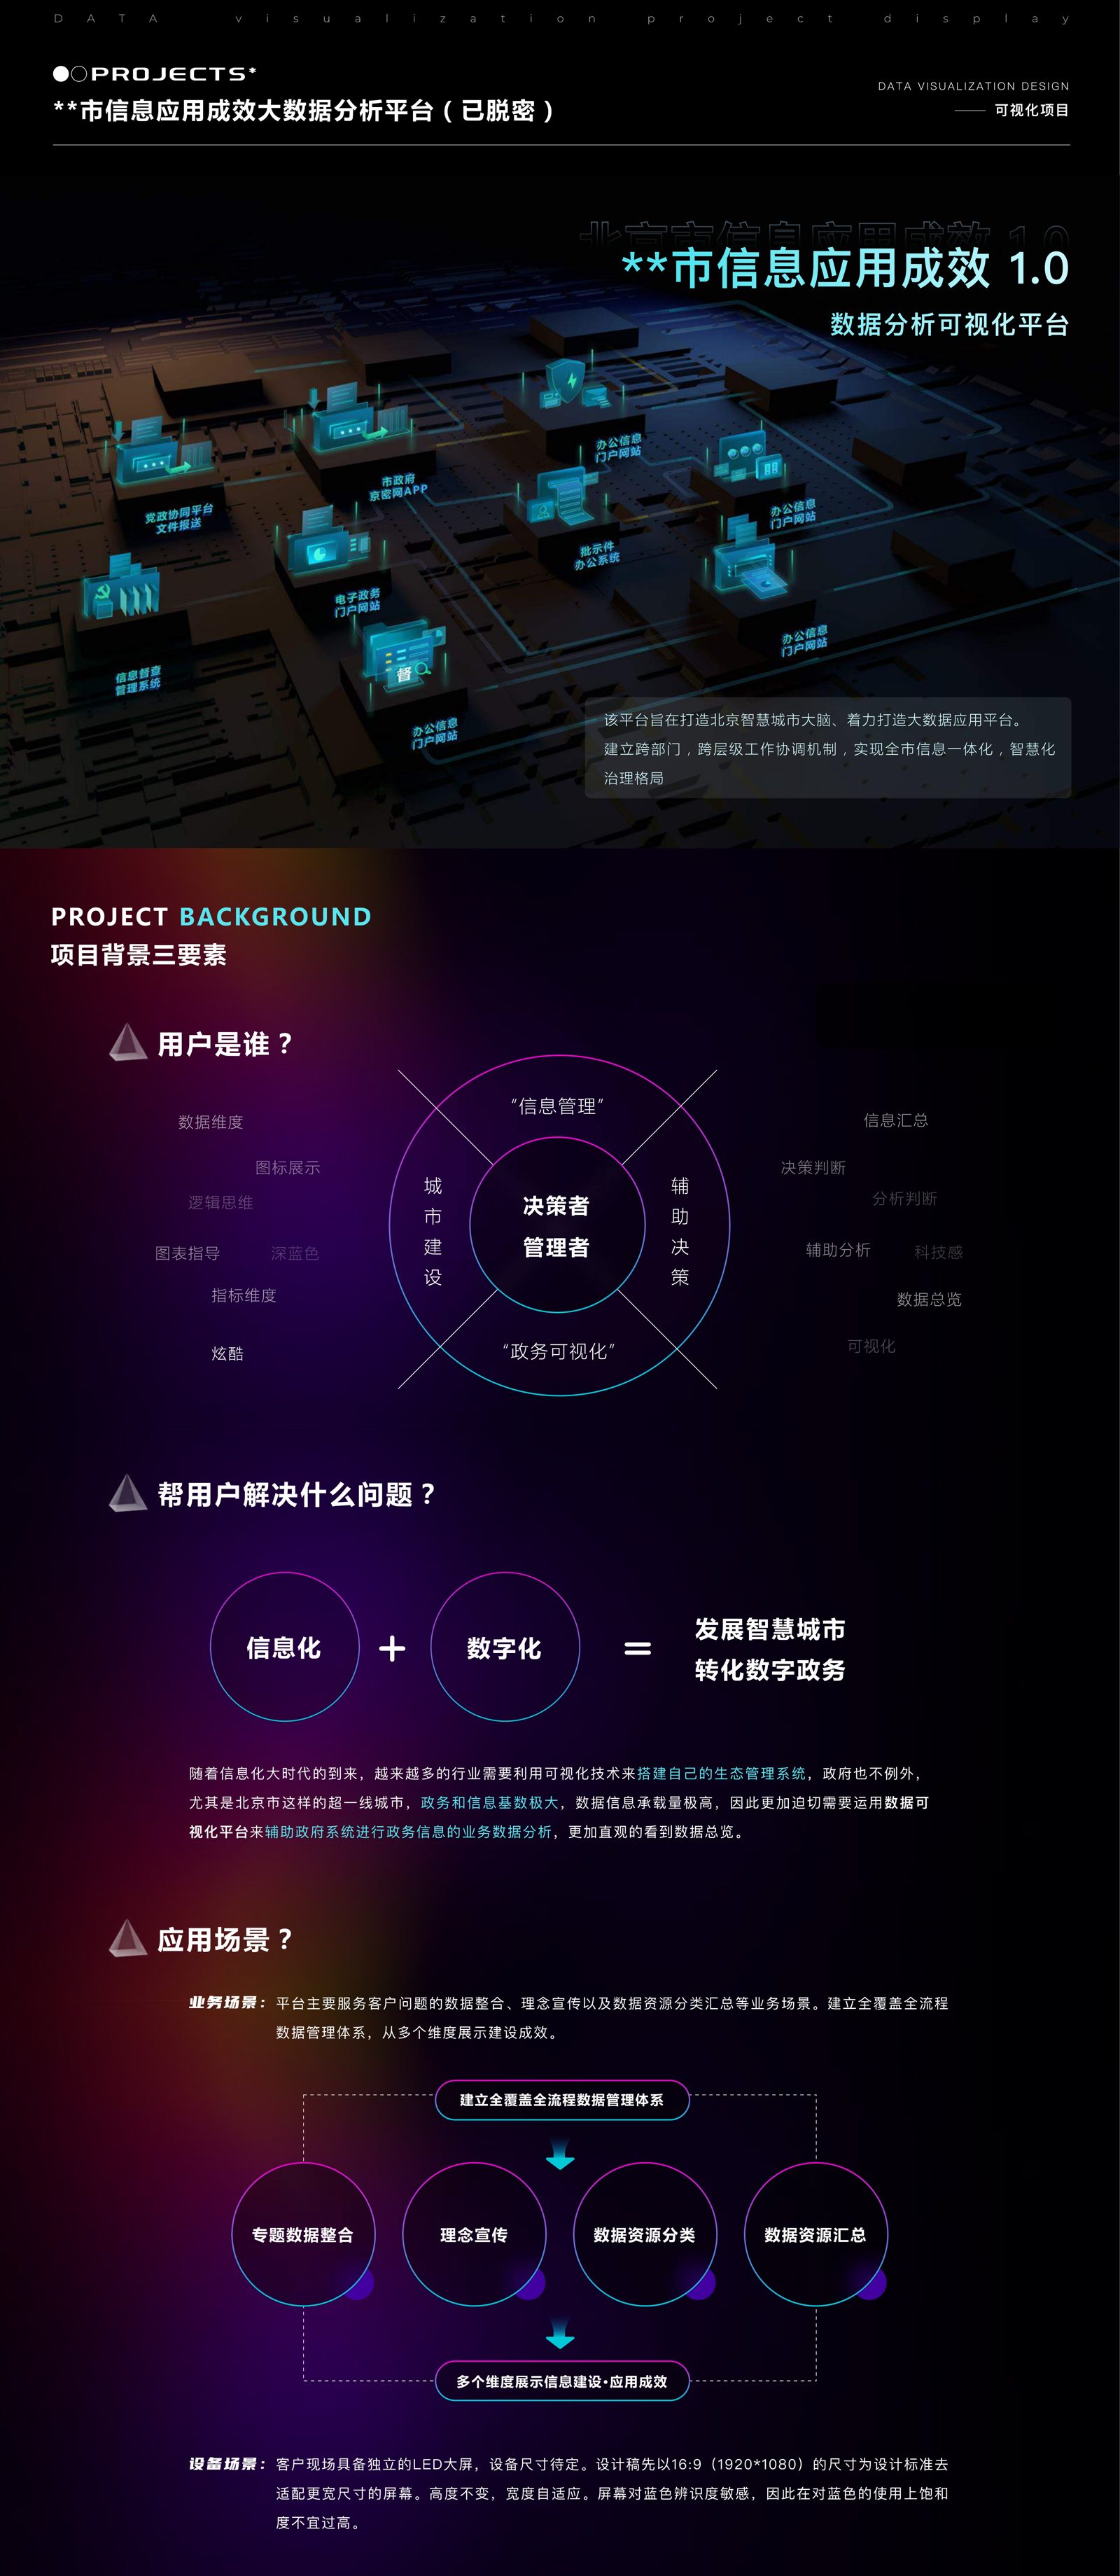
A large-screen data visualization platform for the Beijing Municipal Government — building the city's "data brain" and turning cross-department, cross-level governance into intuitive, decision-ready command-center dashboards.
- Client
- Huayu Software
- Sector
- Government · Smart City
- Role
- Data Visualization Design
- Deliverable
- LED Command-Center Screens
Why the city needed a data brain.
For a super first-tier city like Beijing, the volume of governance and information data is enormous. Decision-makers and managers needed a visualization platform to consolidate, classify and summarize data across departments — establishing a full-coverage, end-to-end data governance system that surfaces information-building results at a glance.
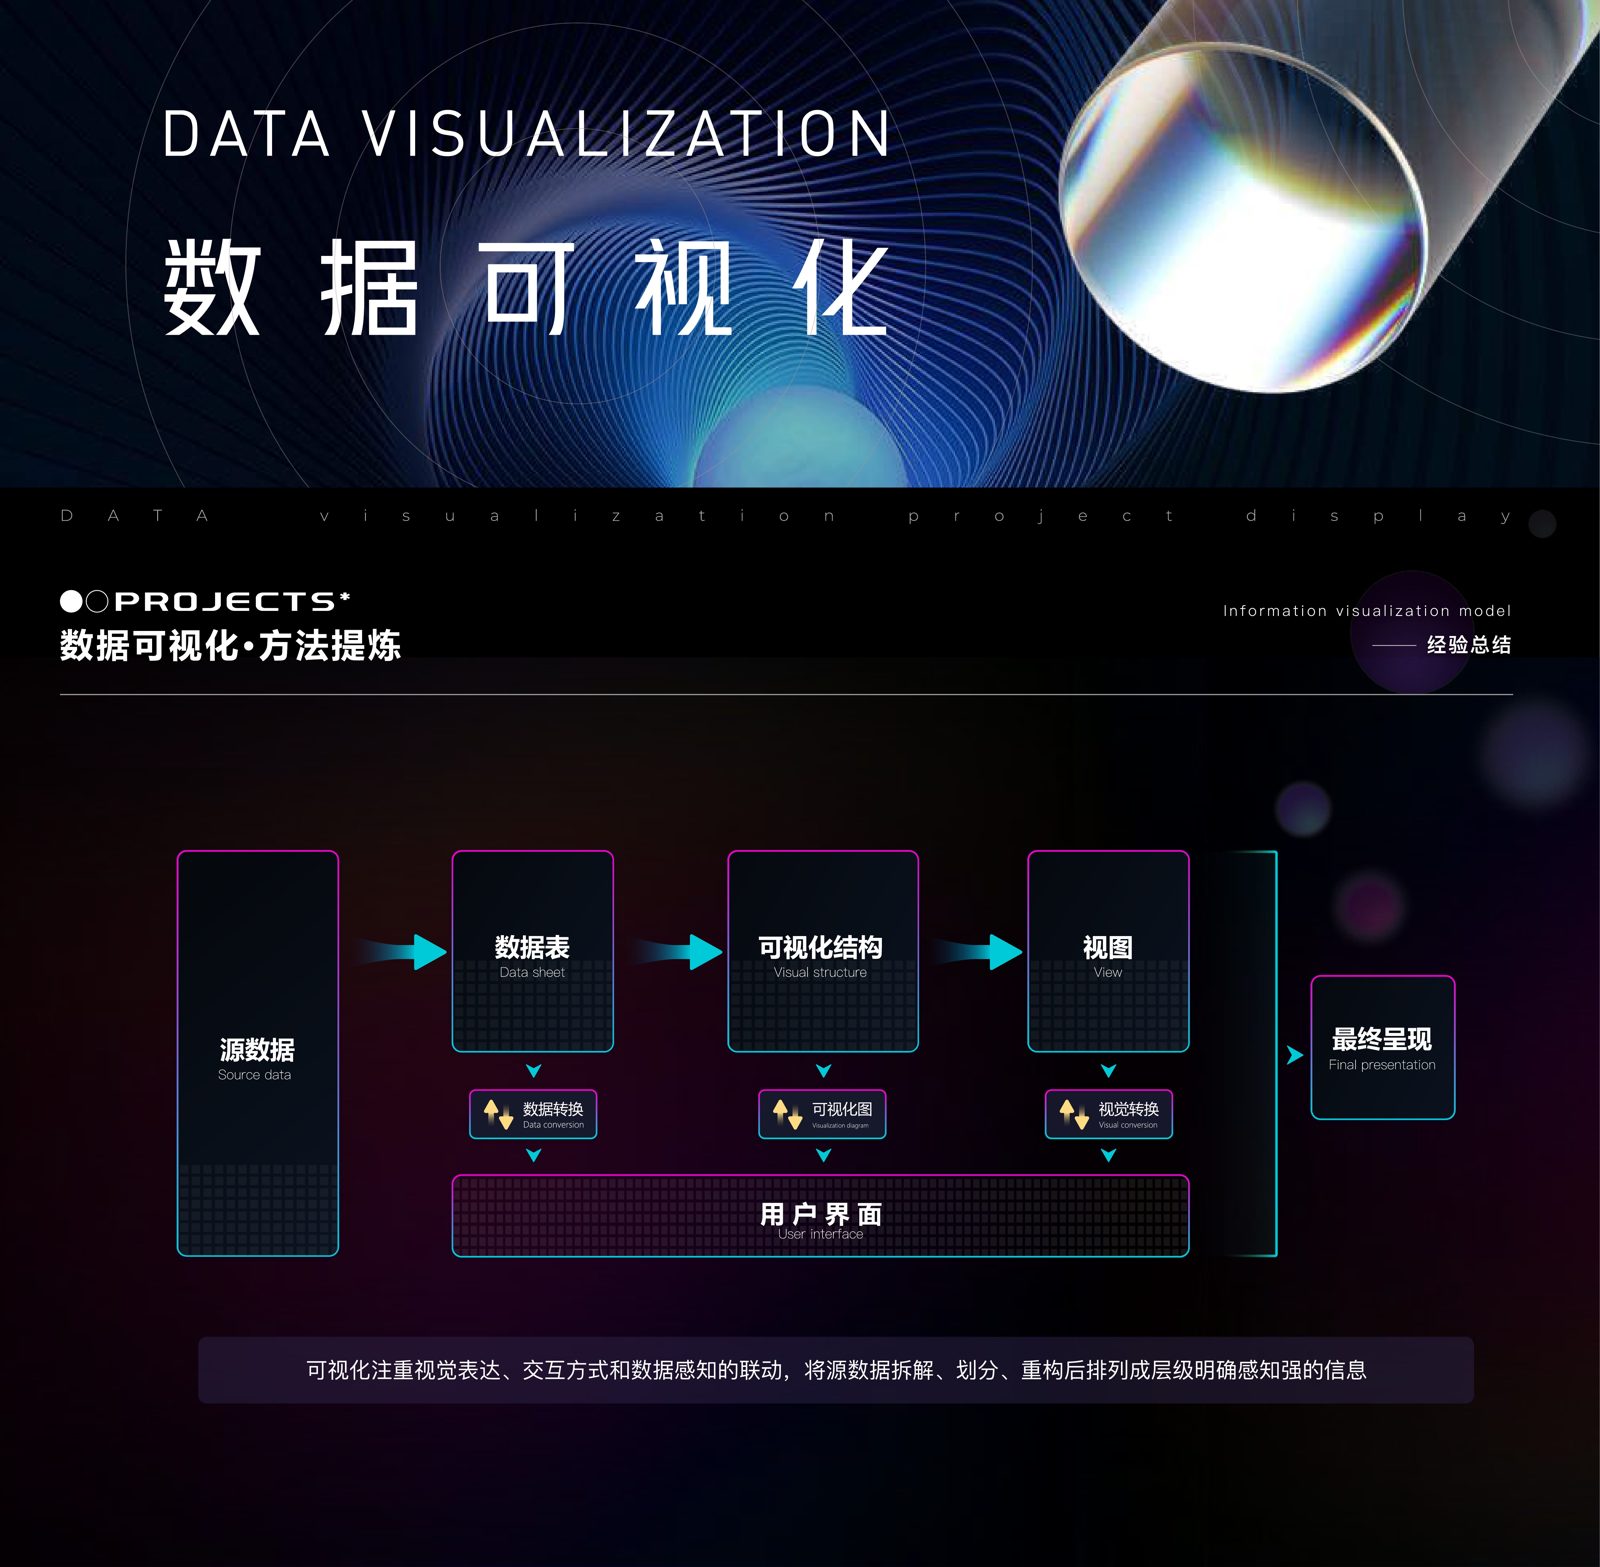
From source data to a final visual narrative.
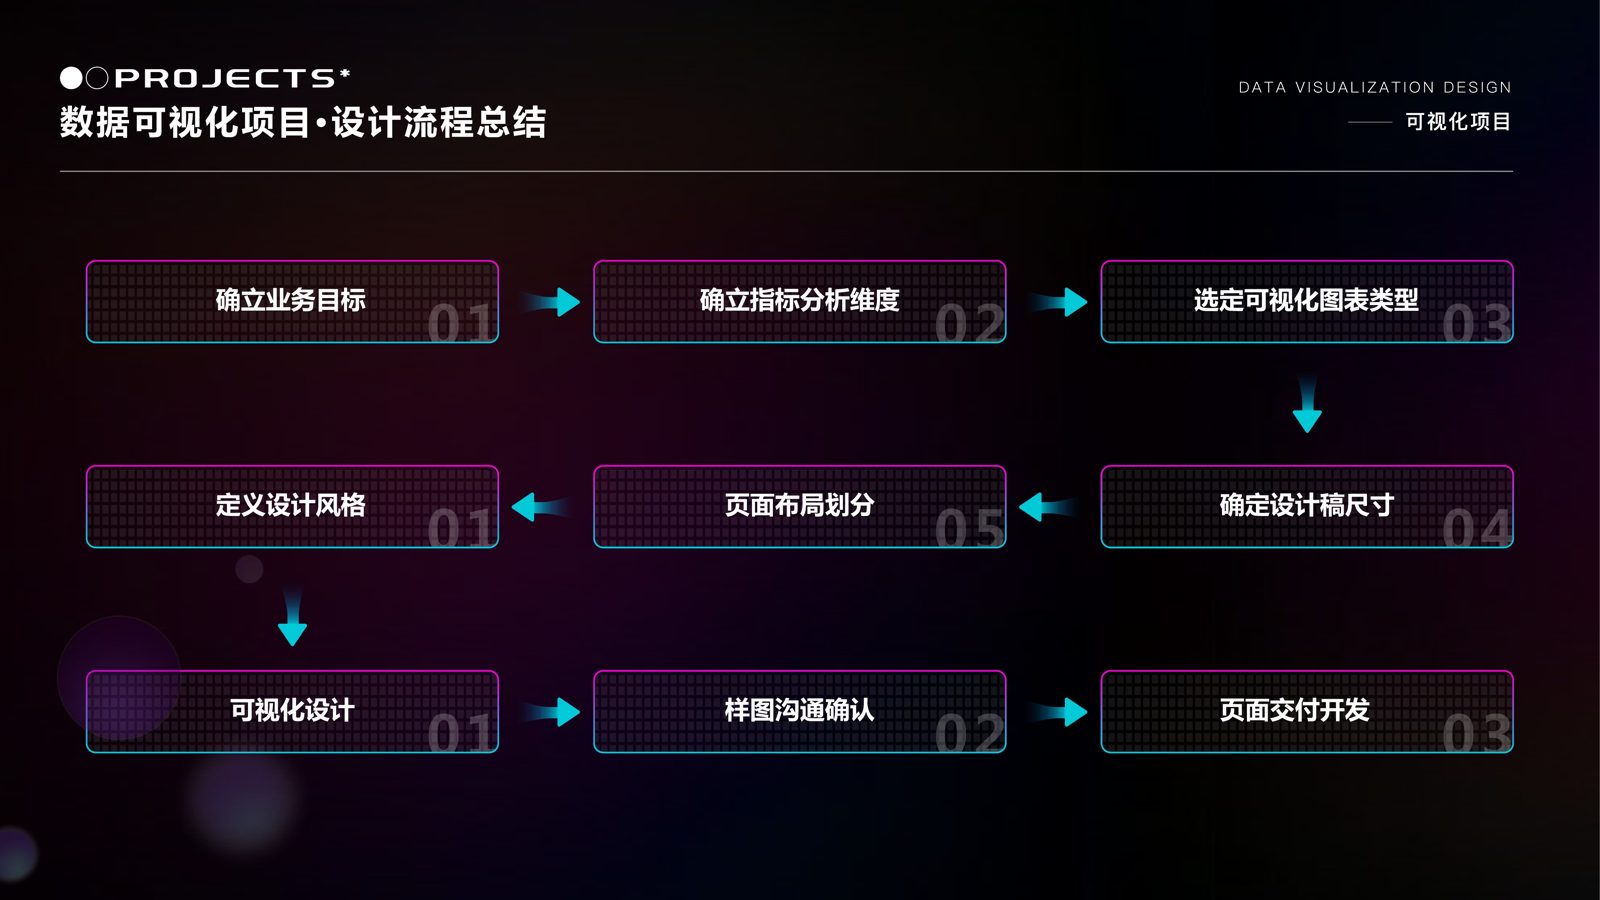
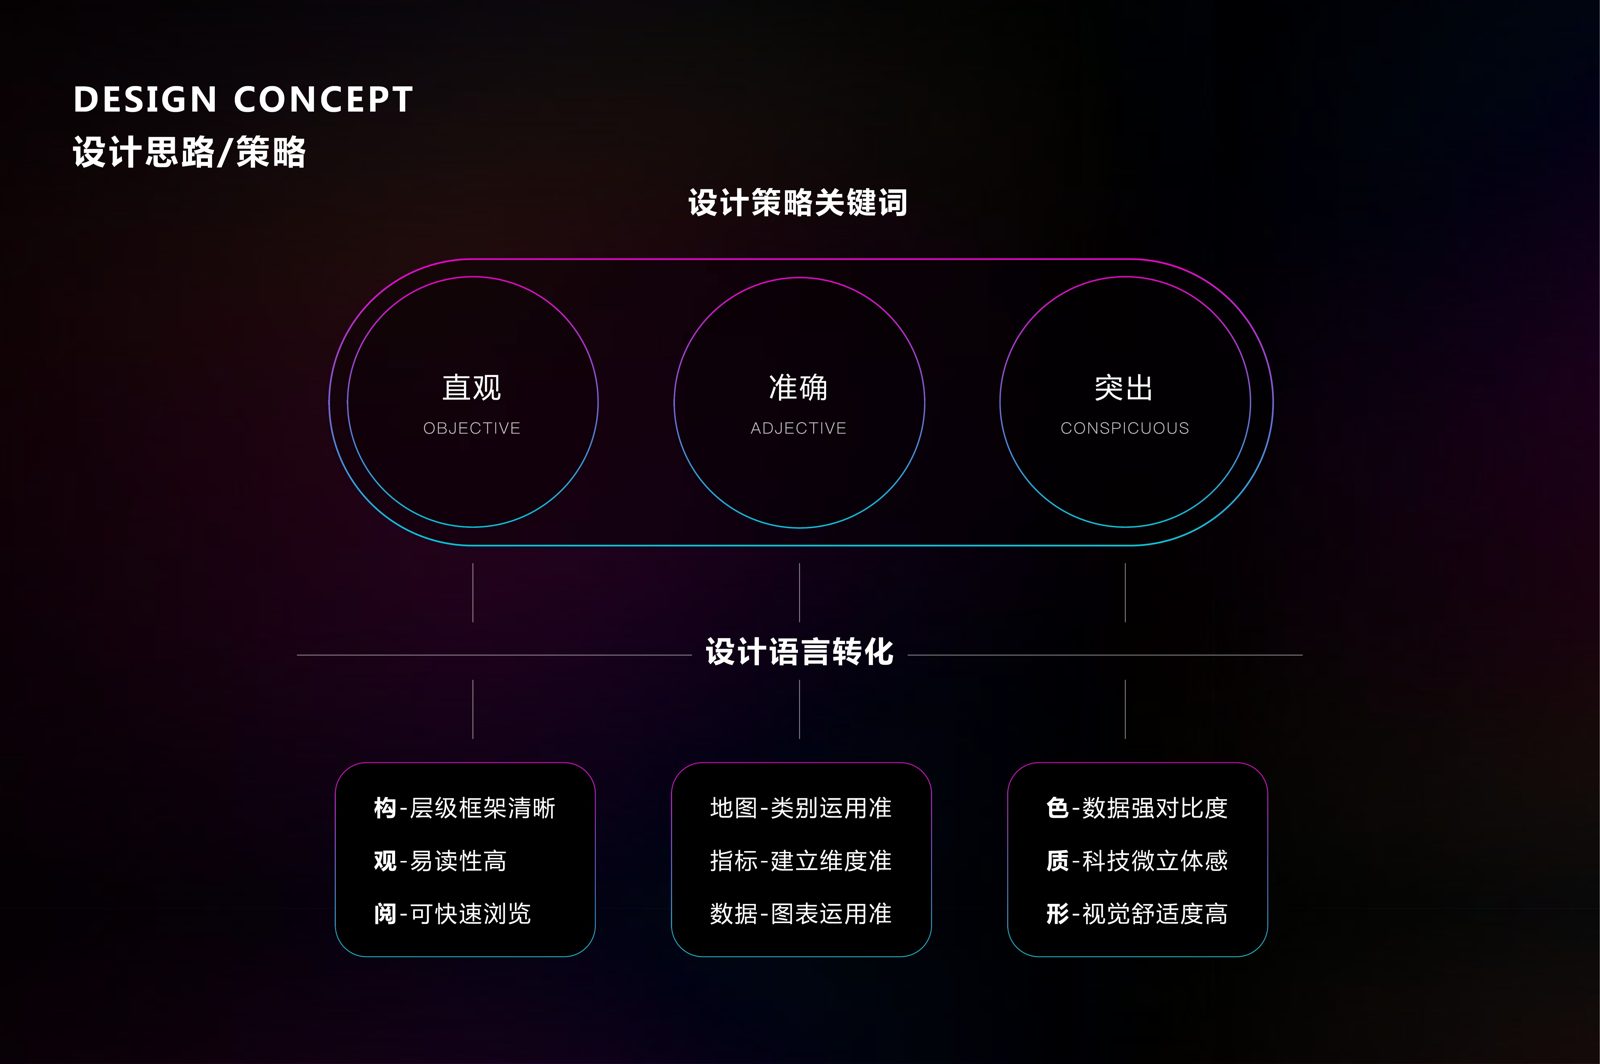
Objective. Accurate. Conspicuous.
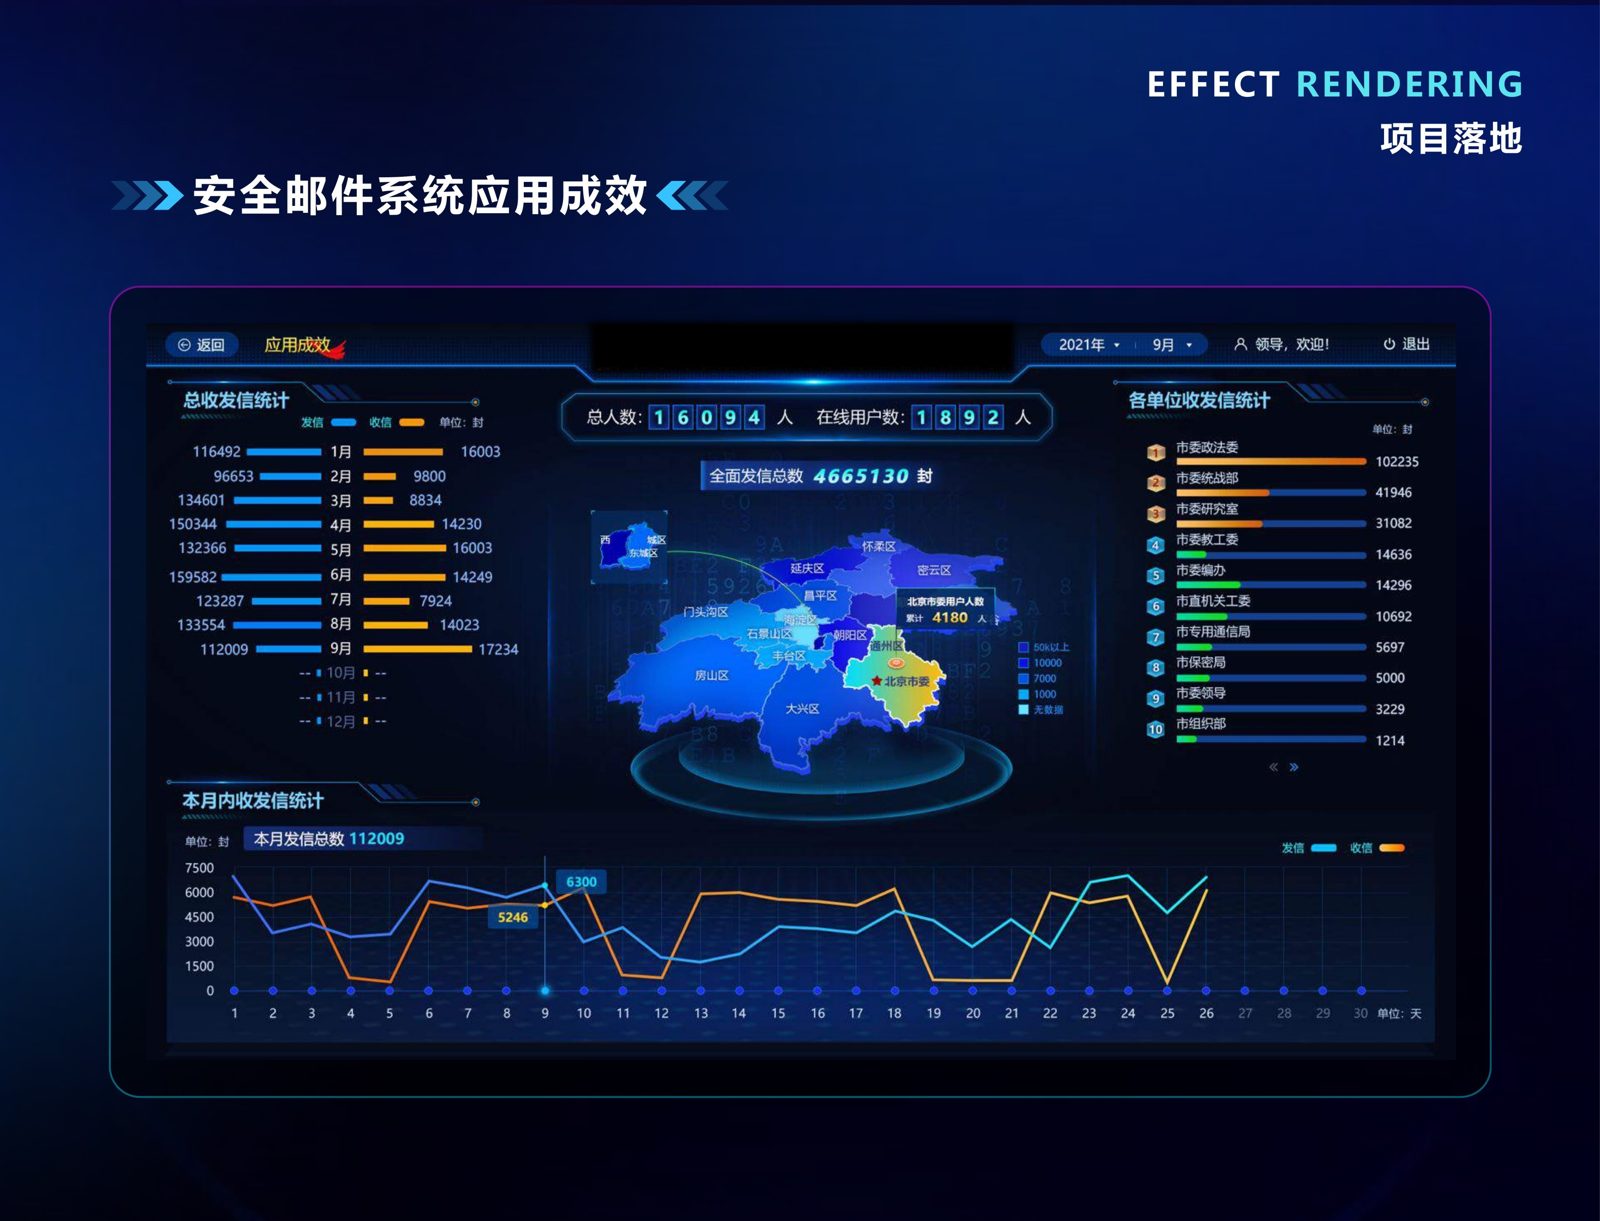
The command-center screens.
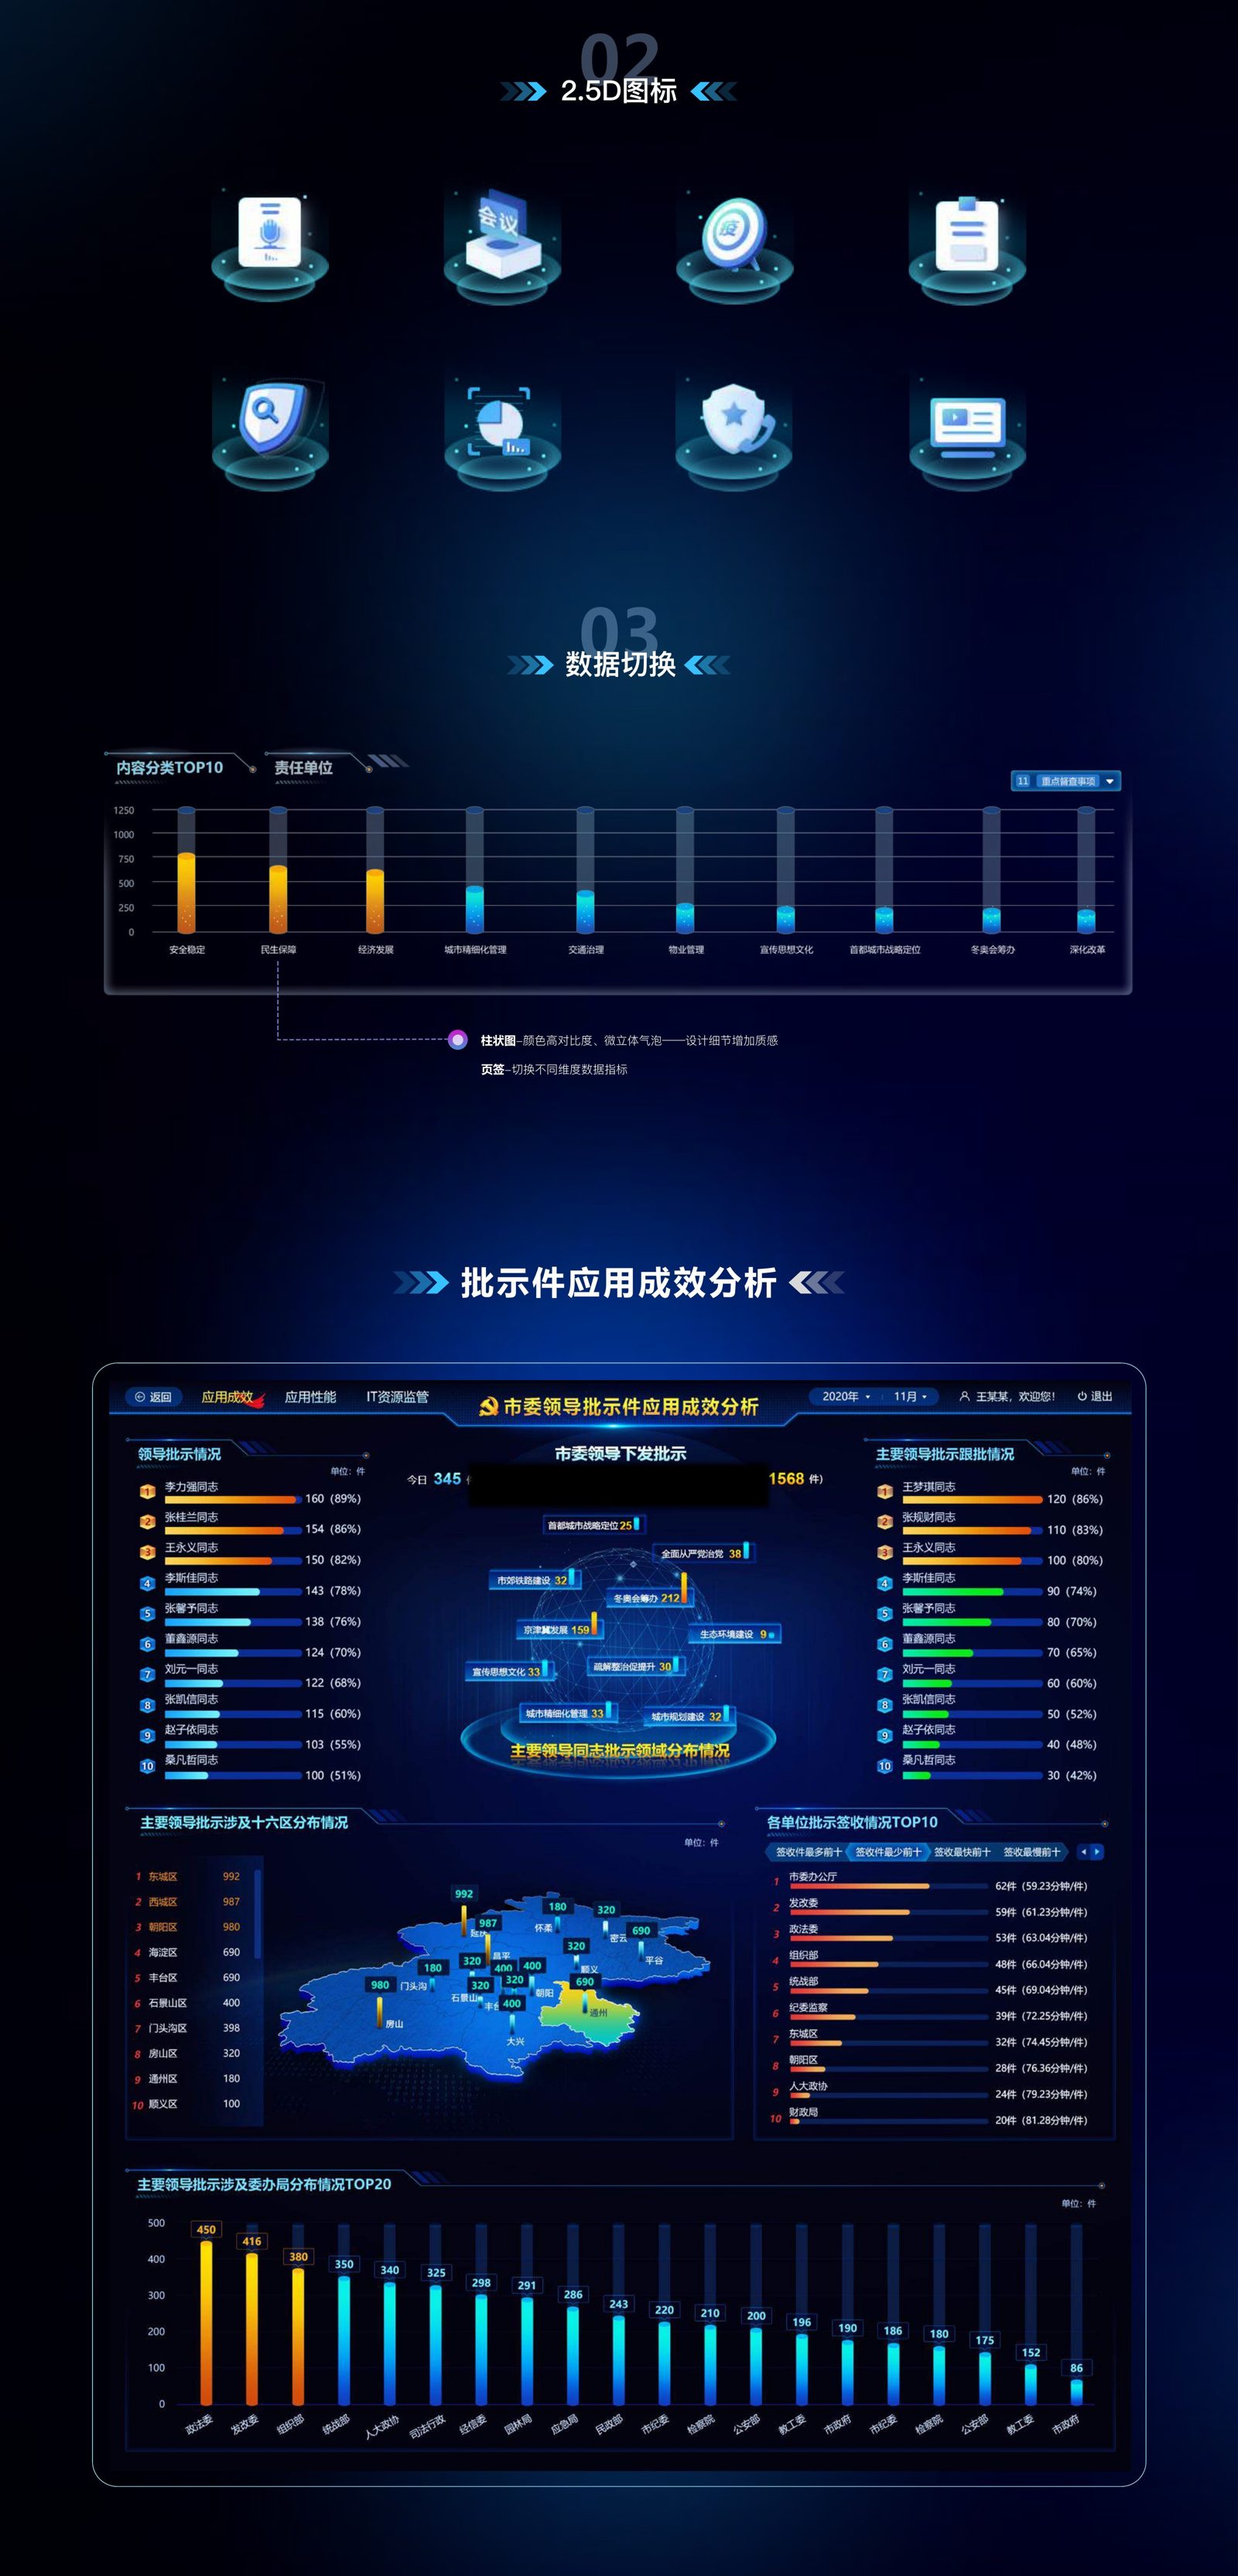
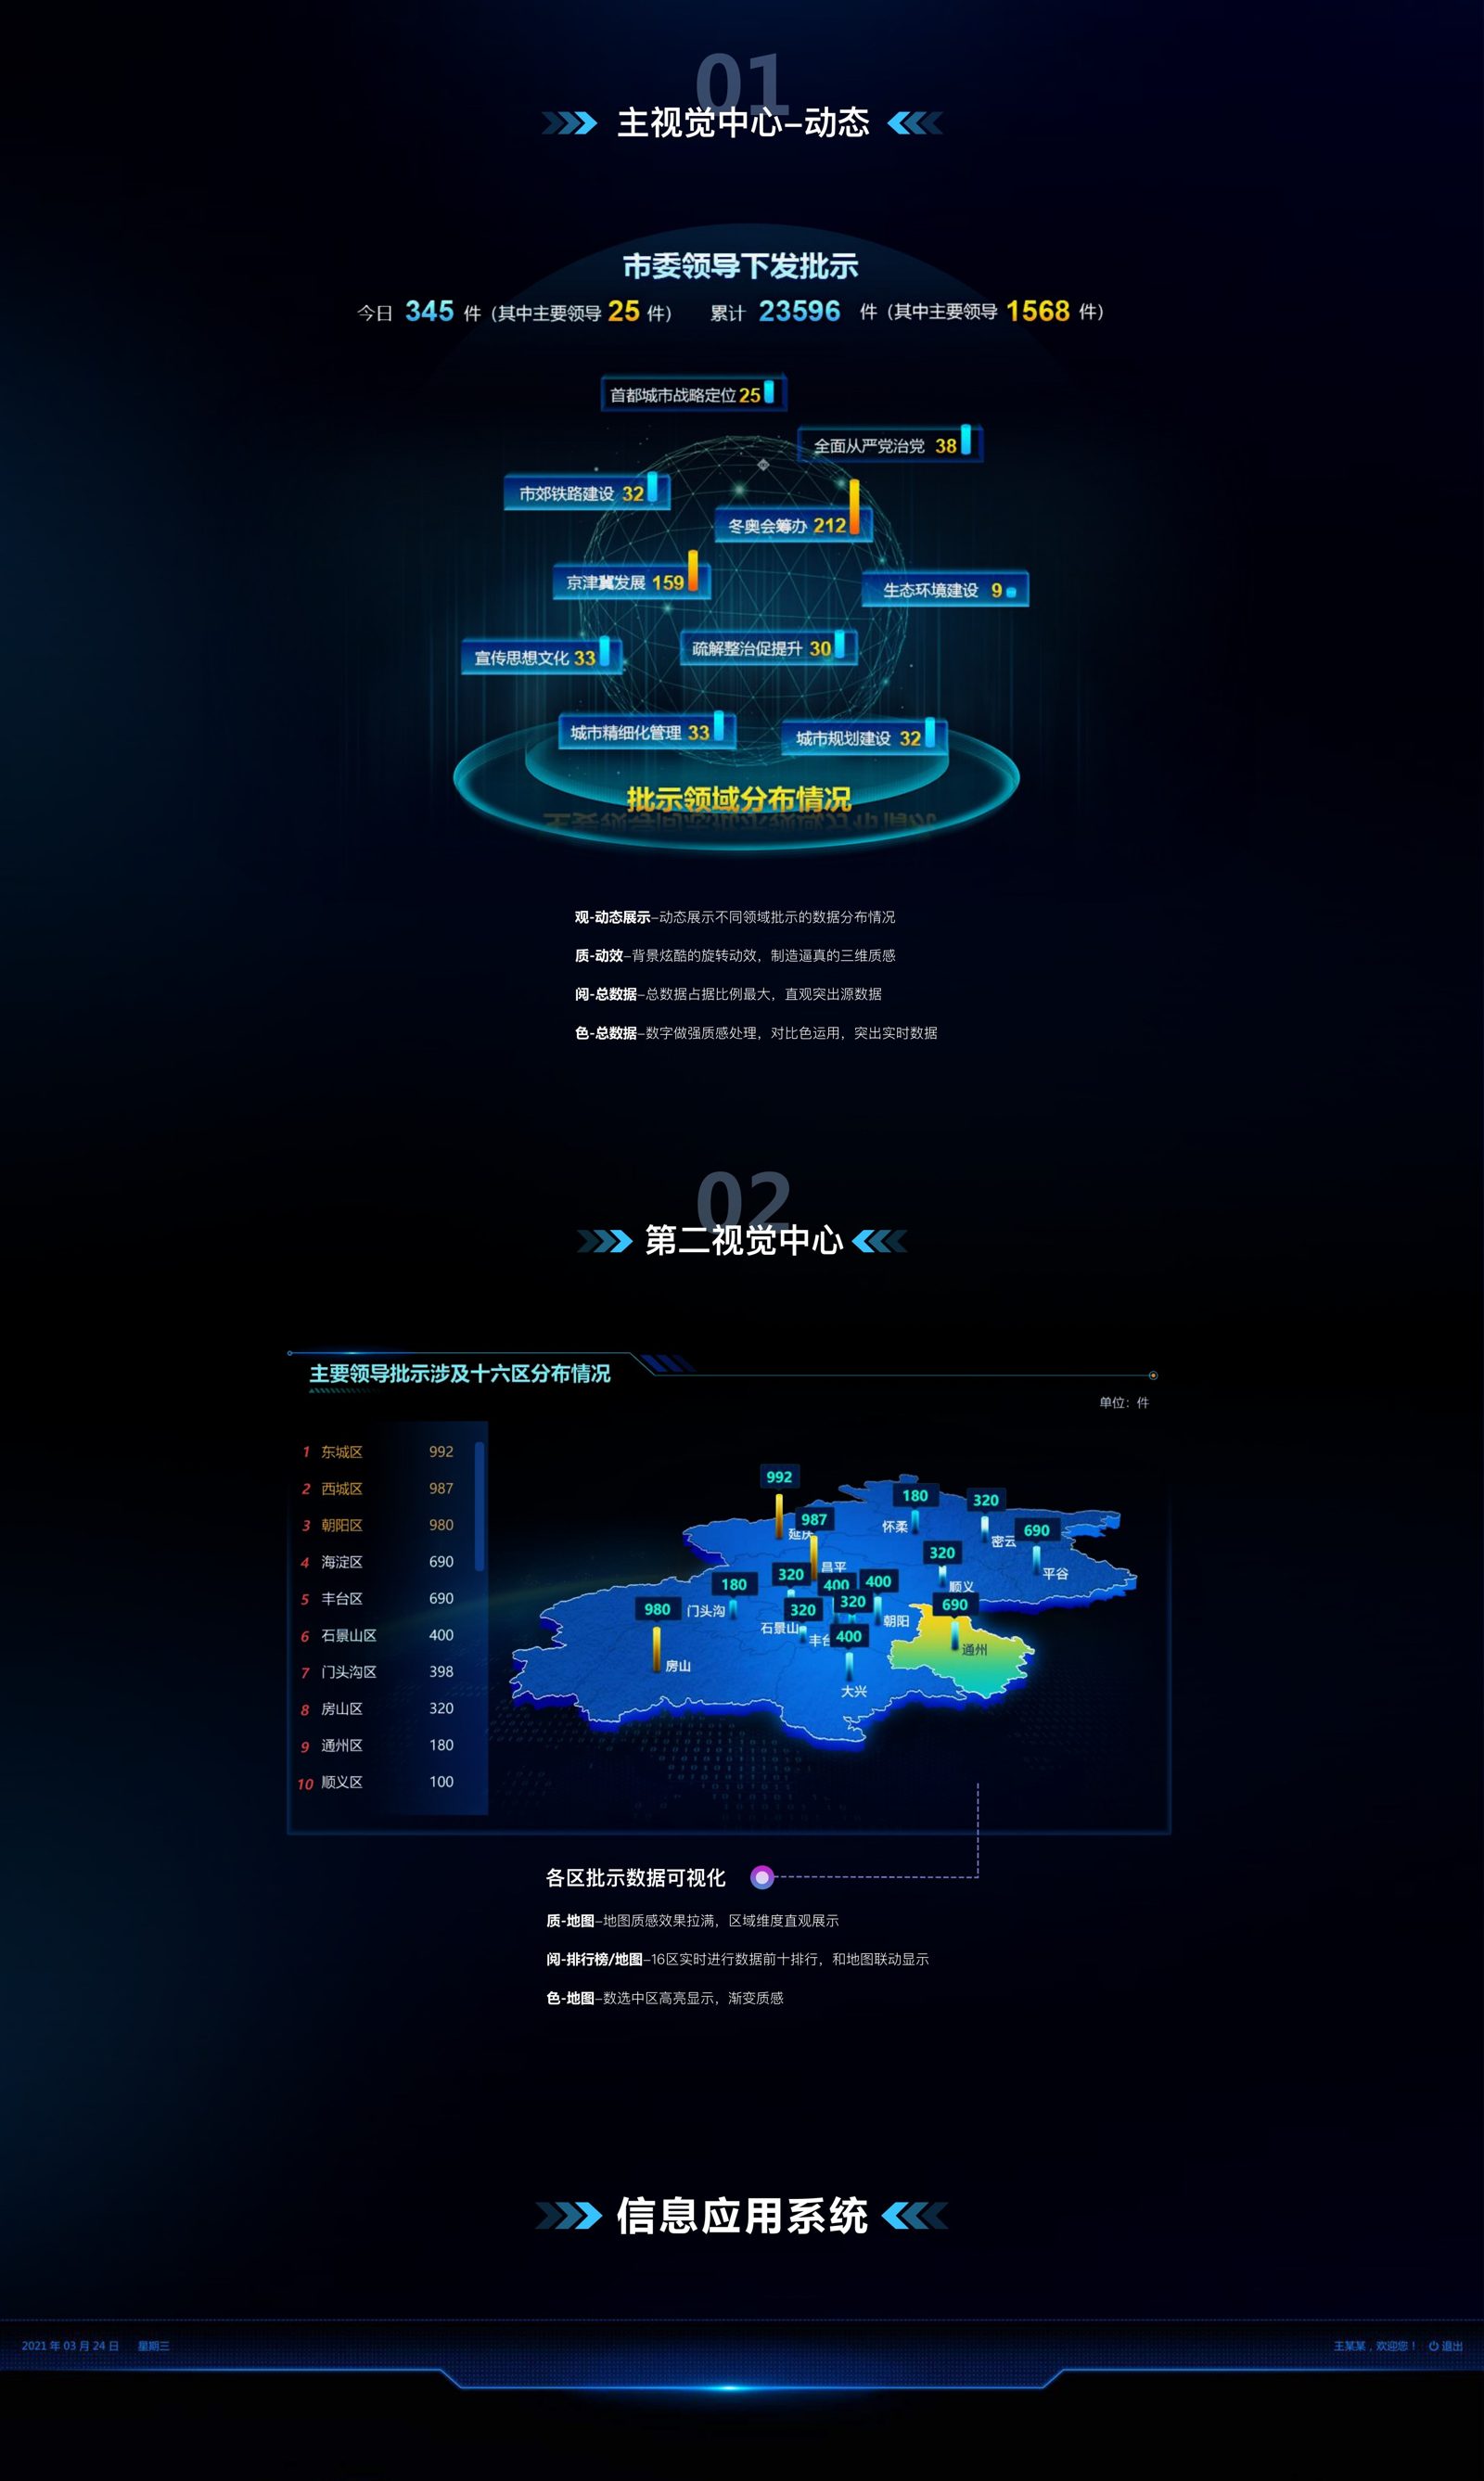
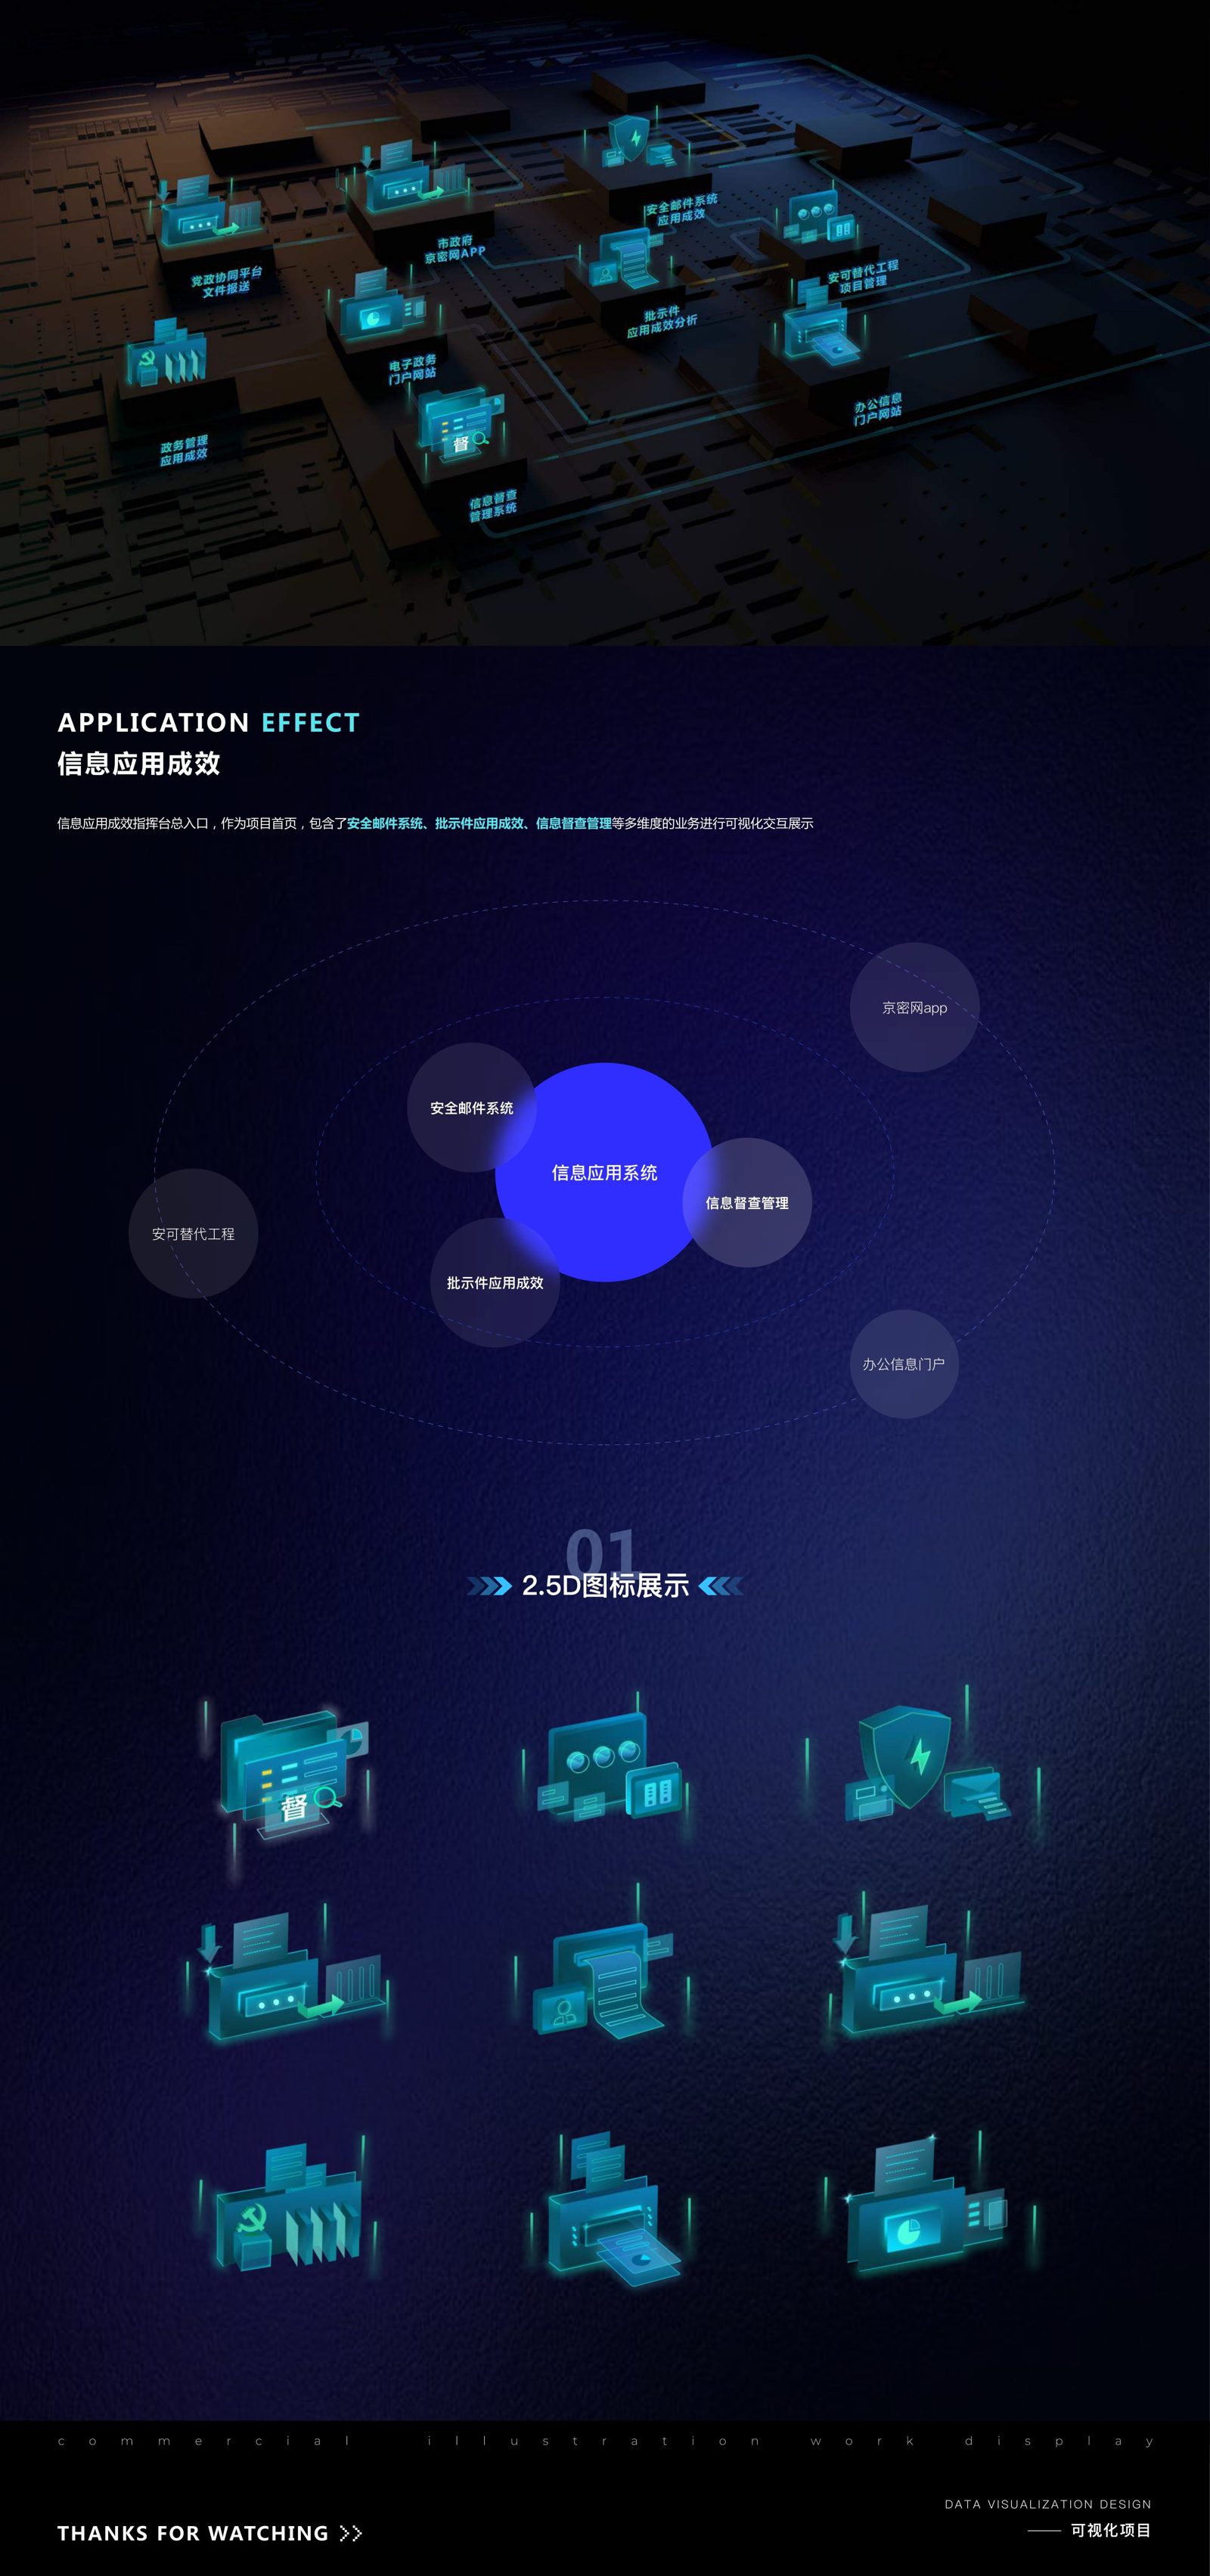
The information effectiveness console acts as the platform's home entry — spanning secure email, directive handling and information supervision across multiple dimensions, each designed for a 16:9 (1920×1080) LED wall that adapts to wider screens.
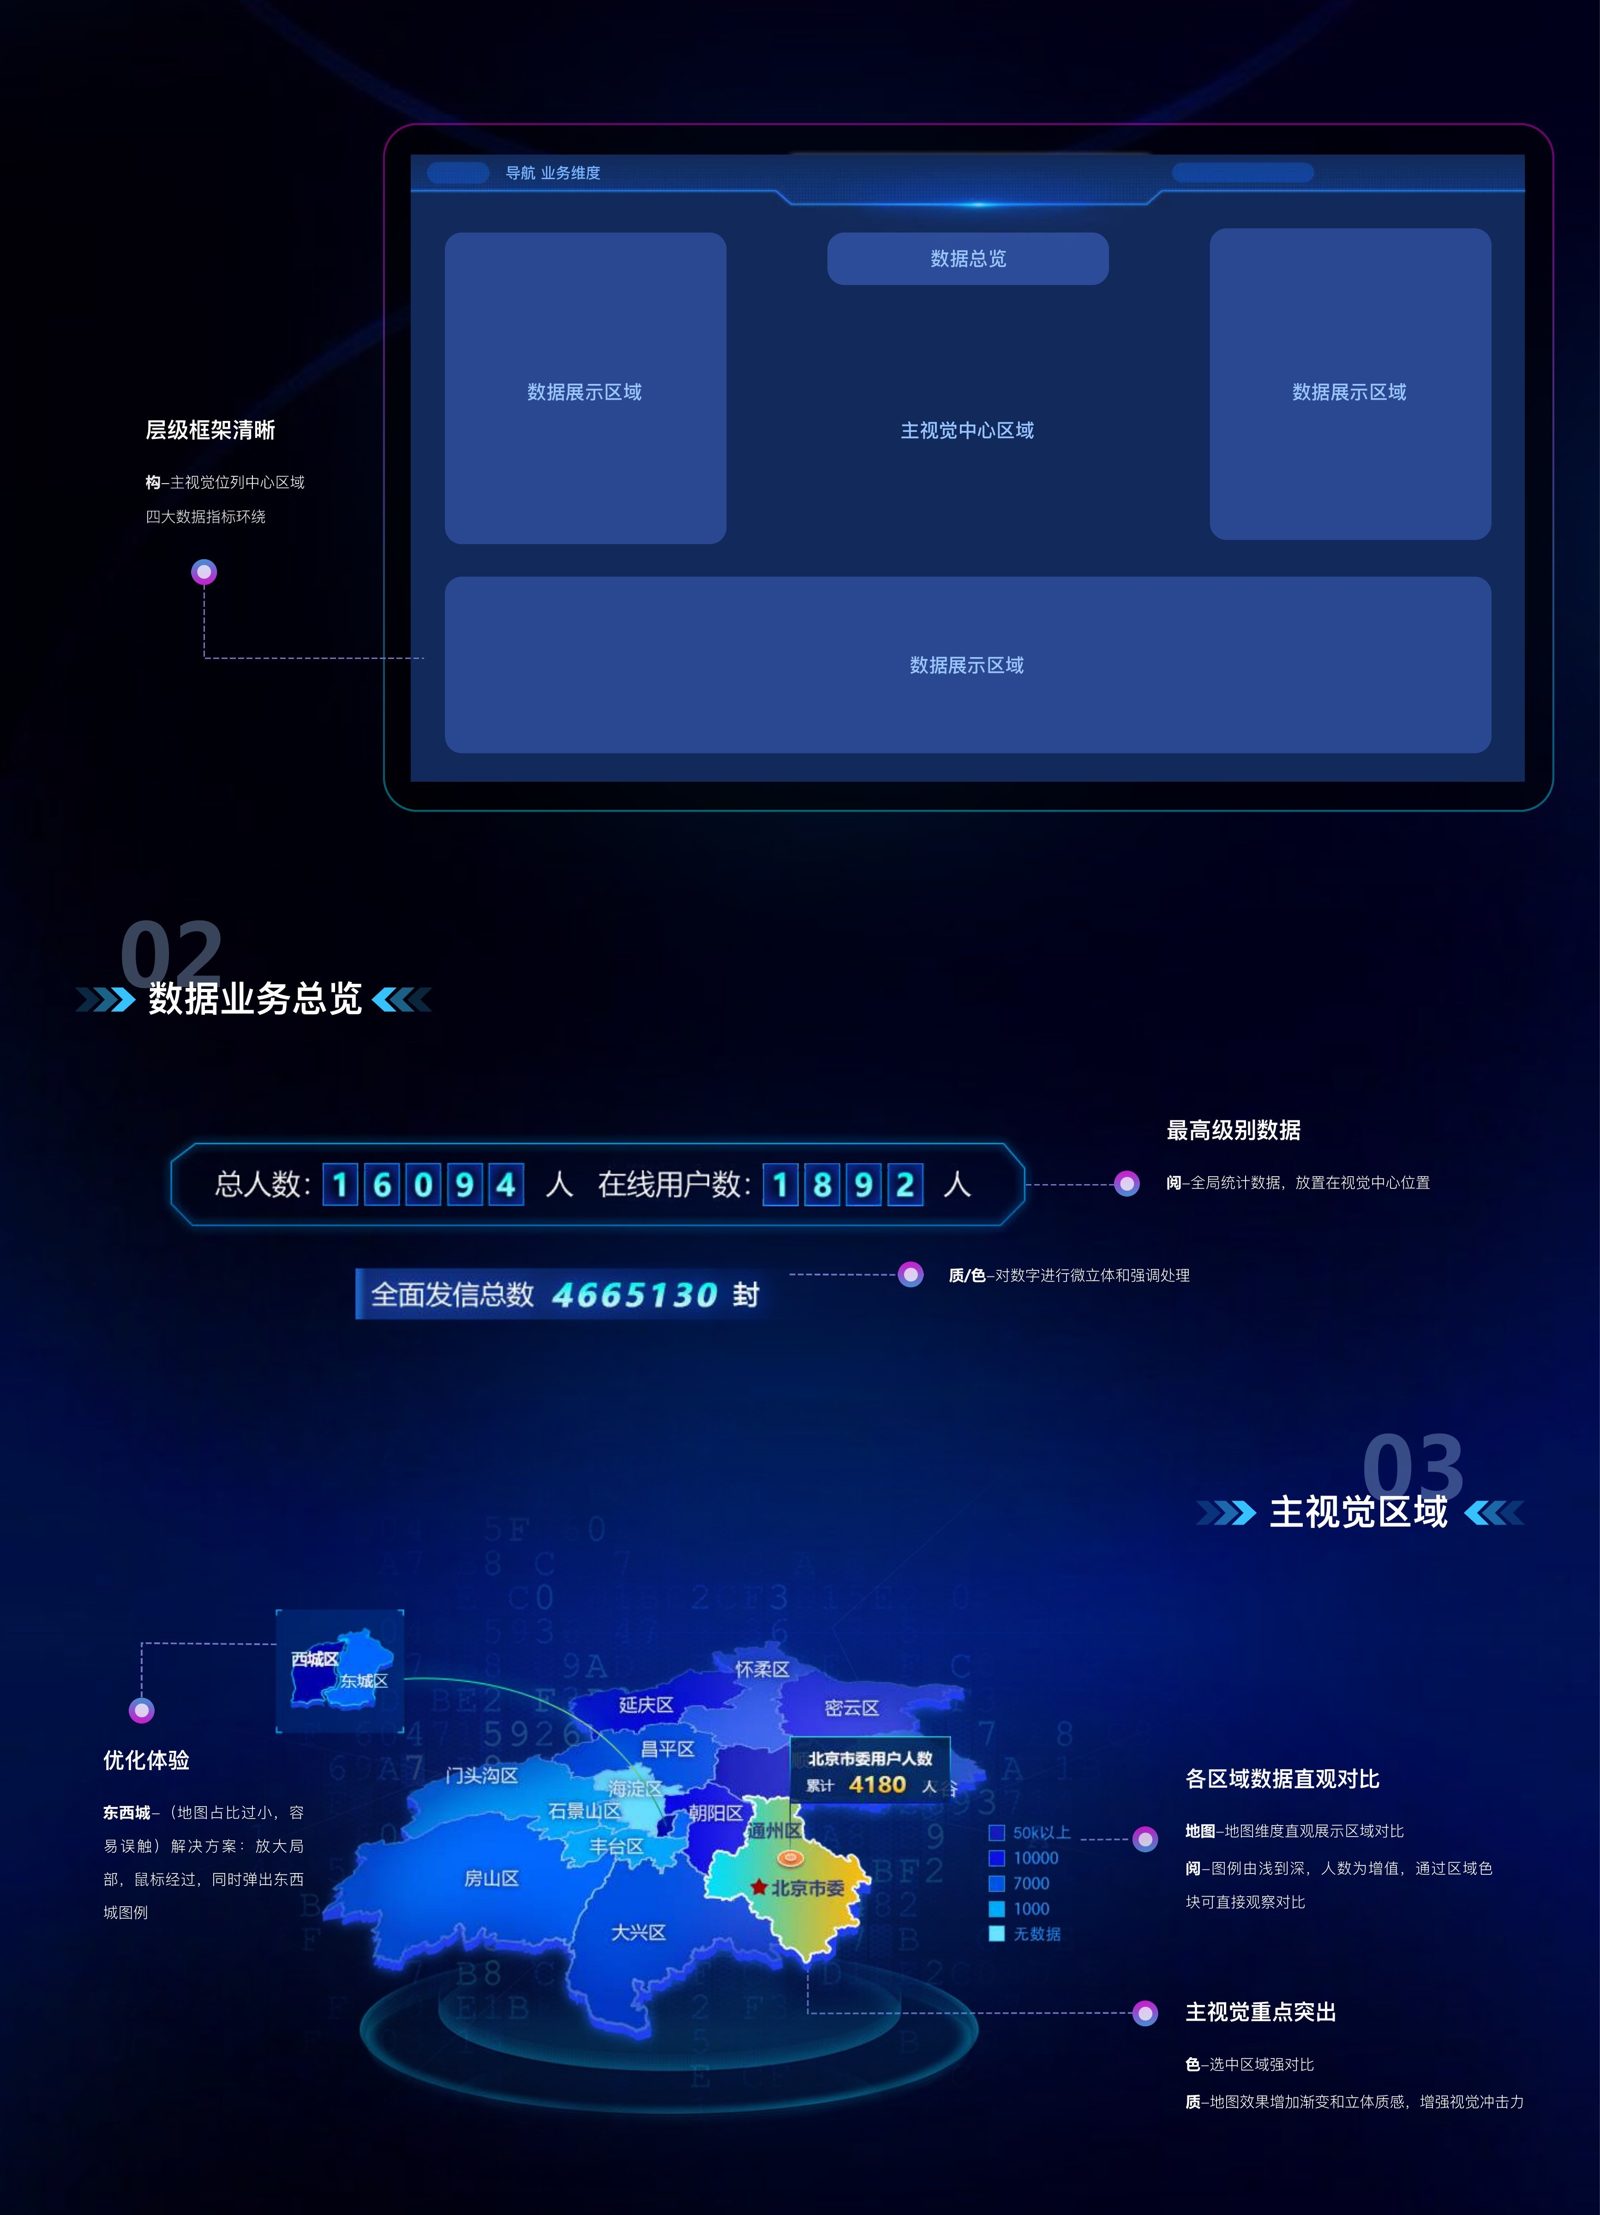
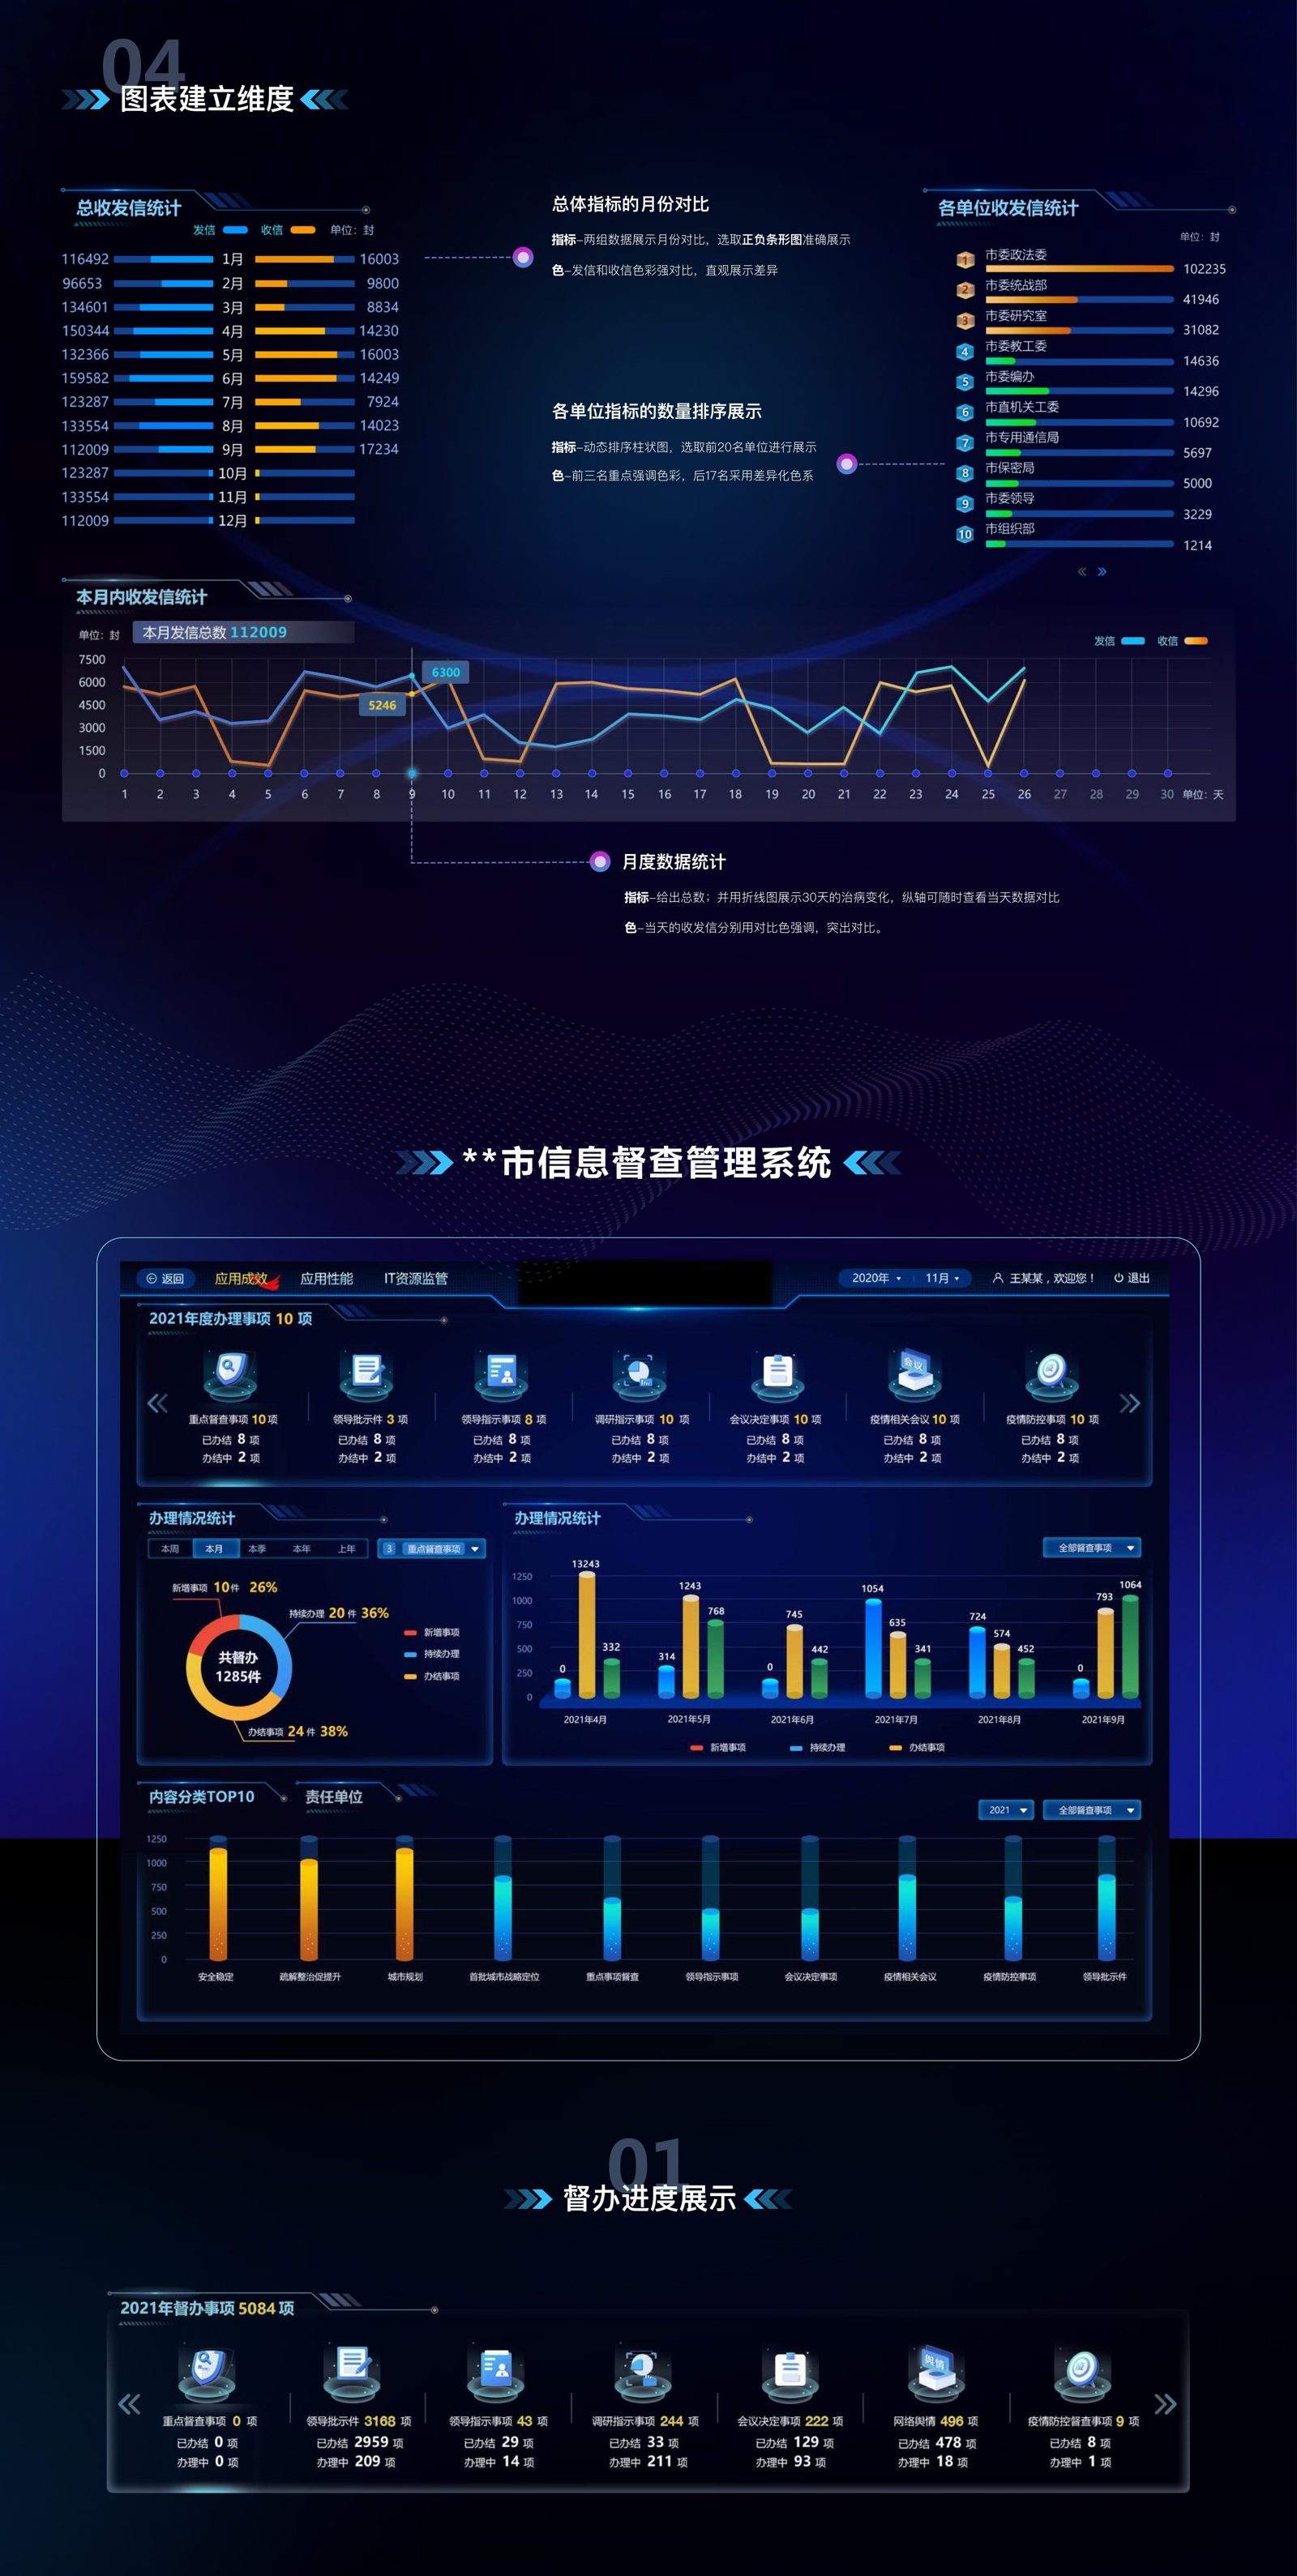
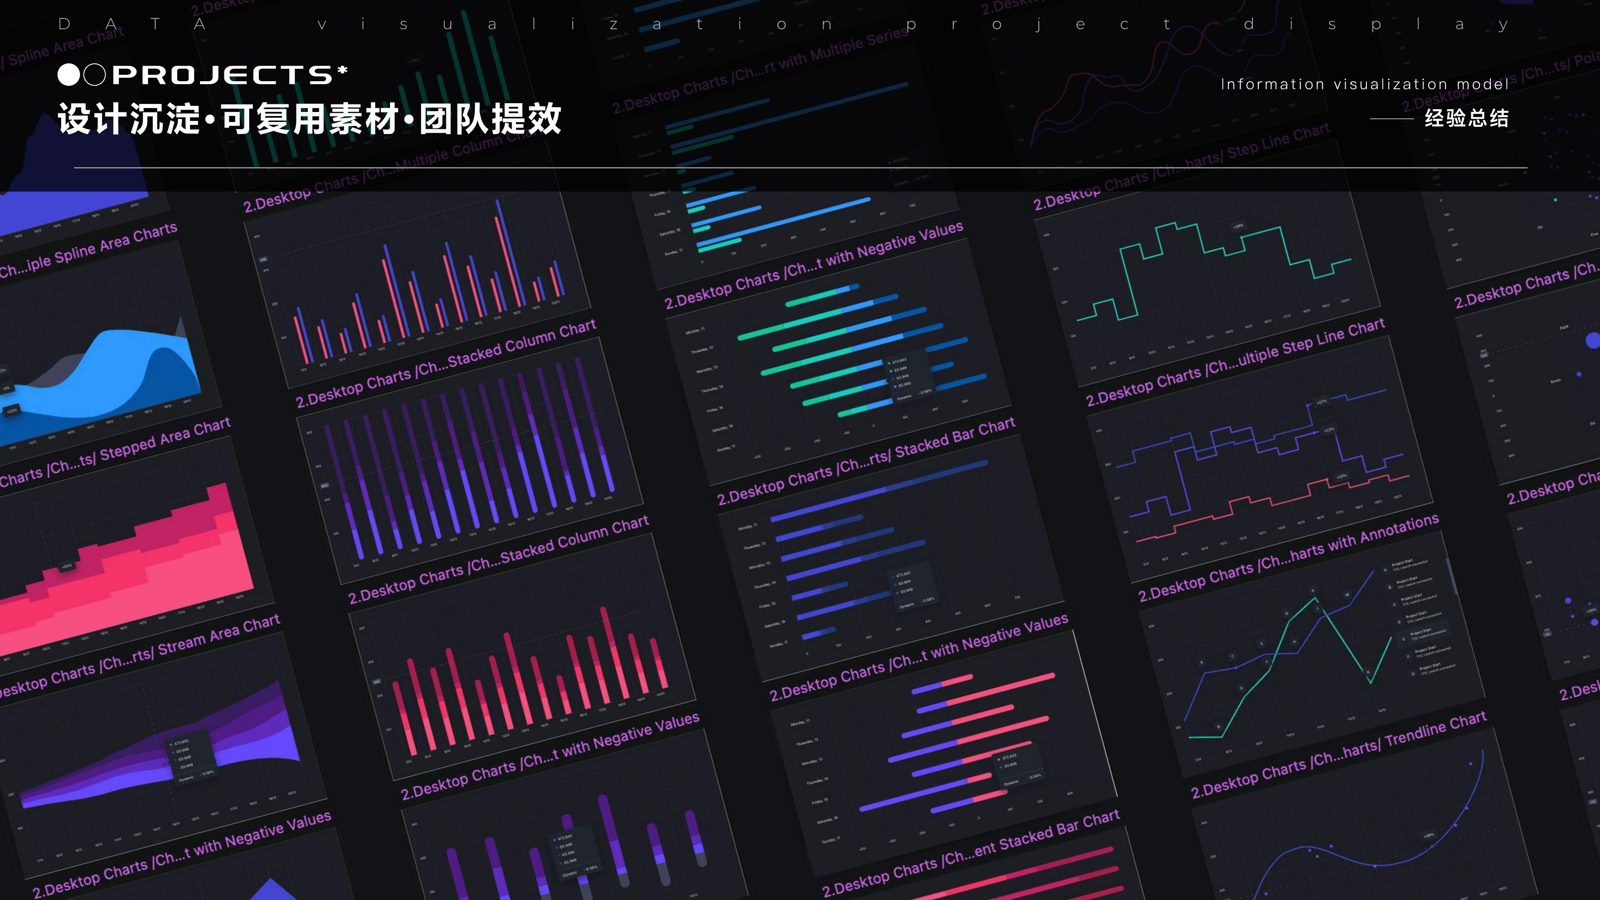
A reusable chart library for the team.
Beyond the screens, the project produced a library of reusable chart components — stacked columns, negative-value bars, step lines, stream areas and annotated trends — codifying design decisions so the whole team could move faster.